What is RSI Indicator and How To Trade With It
In the ever-evolving field of Forex trading and technical views, where market dynamics change rapidly and unpredictably, traders rely on a set of tools and Forex indicators to navigate the complexities of financial markets. Among these tools, one that has garnered widespread acclaim and is essential for many traders is the Relative Strength Index (RSI) indicator.
Developed by J. Welles Wilder Jr. in the late 1970s, the RSI Indicator is a revered and robust momentum oscillator known for its effectiveness in measuring the speed and magnitude of price movements. This article from Omega Finex broker delves into the complexities of this indicator, explaining its mechanics, interpretive differences, practical applications, and inherent limitations in the context of Forex trading.
Introduction to the RSI Indicator
The Relative Strength Index is a popular momentum oscillator used in technical analysis to measure the speed and change of price movements. Developed by J. Welles Wilder Jr. in the late 1970s, the RSI is widely used by traders in various financial markets, including Forex, stocks, and commodities trading. The RSI oscillates between 0 and 100 and is usually represented as a line on a price chart.
Based on the ratio of average gains to average losses over a specified period, typically calculated over 14 periods, this parameter can be adjusted according to traders’ preferences. An RSI above 70 usually indicates that an asset may be overbought, suggesting potential exhaustion in buying pressure and a possible corrective decline.
Conversely, an RSI below 30 suggests that an asset may be oversold, indicating excessive selling pressure and a potential price rebound. The RSI indicator is versatile and can be used in various trading strategies, including identifying trend reversals, confirming trend strength, and detecting divergence between price and momentum.
Calculating the RSI Indicator involves several sequential steps:
- Calculating Average Gain and Loss: The total gains and losses over the specified period are summed and divided by the number of periods.
- Relative Strength (RS): The average gain is divided by the average loss to obtain the relative strength.
- Calculating RSI: The RSI is then calculated using the formula RSI = 100 – (100 / (1 + RS)).
Interpreting the RSI Indicator
The Relative Strength Index provides multifaceted insights into market dynamics with several key interpretations:
Overbought and Oversold Conditions: Traditionally, an RSI above 70 indicates overbought conditions, suggesting potential overvaluation and an imminent corrective decline. Conversely, an RSI below 30 is considered oversold, indicating undervaluation and a potential corrective rise.
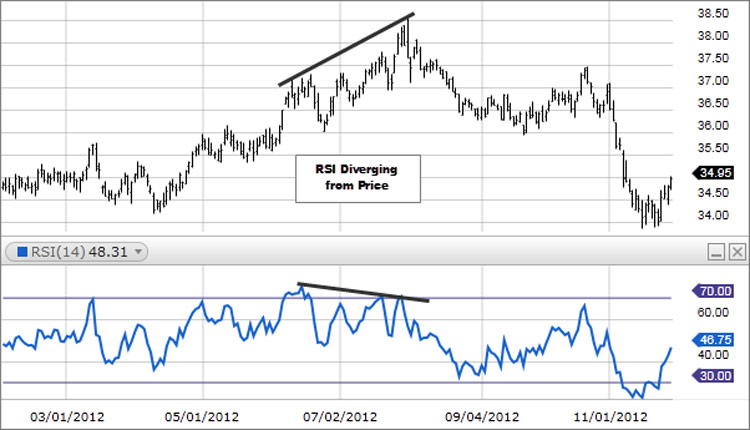
Divergence Analysis: Divergence occurs when price movement contrasts with the RSI movement, offering valuable signals to savvy traders. Bullish divergence occurs when prices hit lower lows while the RSI forms higher lows, indicating a potential upward reversal. Conversely, bearish divergence appears when prices hit higher highs while the RSI forms lower highs, signaling a potential downward correction.
Confirming Trends: The behavior of the RSI indicator in relation to the 50 level can act as a gauge for the strength of Forex trends. During uptrends, the RSI is usually above 50, while during downtrends, it tends to stay below 50. Therefore, crossing above or below 50 can provide traders with insights into the strength or weakness of prevailing trends.
Practical Application of the RSI Indicator in Forex Trading
Trading using the Relative Strength Index involves employing various strategies that capitalize on the insights offered by this versatile tool. Below are some popular strategies used by Forex traders with the RSI indicator:
Overbought and Oversold Strategy with RSI
Goal: Identify potential reversal points based on overbought or oversold conditions using the RSI indicator.
Method:
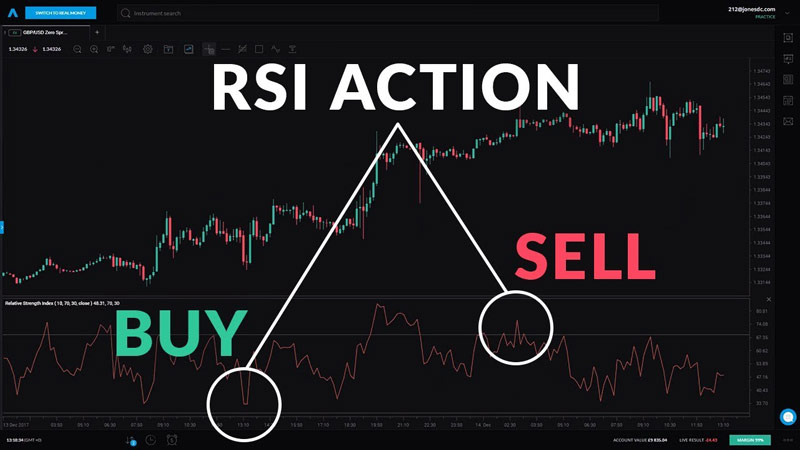
Overbought Conditions (RSI > 70): When the RSI indicator rises above the 70 threshold, it indicates that an asset may be overvalued and due for a corrective decline. Traders may consider starting short positions or closing long positions.
Oversold Conditions (RSI < 30): Conversely, when the RSI indicator falls below 30, it indicates that an asset may be undervalued and poised for a corrective rise. Traders may consider entering long positions or closing short positions.
Considerations:
- Confirm signals with other indicators like moving averages or MACD, and price action patterns.
- Implement risk management measures to mitigate losses in case of false signals.
Divergence-Based Strategy with RSI Indicator
Goal: Identify potential trend reversals based on the discrepancy between price and Relative Strength Index readings.
Method:
Bullish Divergence: Occurs when the price makes a lower low while the RSI makes a higher low, indicating weakening downward momentum and a potential upward reversal.
Bearish Divergence: Occurs when the price makes a higher high while the RSI makes a lower high, indicating weakening upward momentum and a potential downward reversal.
Considerations:
- Exercise patience and wait for confirmed signals before entering trades using the RSI.
- Use additional confirmation from other Forex indicators or chart patterns.
- Implement effective risk management to minimize potential losses.
Trend Confirmation Strategy with Relative Strength Index
Goal: Confirm the strength of prevailing trends using RSI readings.
Method:
During an uptrend, the RSI tends to stay above 50, while during a downtrend, it tends to stay below 50.
Traders may consider starting long positions when the RSI crosses above 50 during an uptrend, indicating potential strength.
Conversely, traders may consider starting short positions when the RSI crosses below 50 during a downtrend, indicating potential continued weakness.
Considerations:
- Combine RSI indicator signals with trend lines, moving averages, or other trend-following indicators for improved confirmation.
- Exercise caution in markets where the RSI may provide conflicting signals.
- Implement risk management techniques to reduce losses in case the trend changes.
Pullback Strategy with Relative Strength Index
Goal: Capitalize on short-term pullbacks within the context of prevailing trends.
Method:
Identify strong trends using price, trend lines, or moving averages.Wait for the RSI to retreat from overbought or oversold levels but remain above or below the 50 level, indicating a pullback within the trend.
Enter trades in the direction of the prevailing trend once the RSI indicator resumes its upward or downward movement after the pullback.
Considerations:
- Use multiple time frames to identify high-probability pullback opportunities.
- Combine Relative Strength Index signals with price action patterns or support/resistance levels for additional confirmation.
- Implement stop-loss orders for effective risk management.
Range Trading Strategy with the Relative Strength Index
Goal: Capitalize on price fluctuations in range-bound market conditions.
Method:
Identify key support and resistance levels that define the trading range.
When the RSI approaches the oversold region (e.g., below 30), initiate buy positions near the support level.
Conversely, when the RSI approaches the overbought region (e.g., above 70), initiate sell positions near the resistance level.
Take profit or consider reversing positions as the price approaches the opposite boundary of the trading range.
Considerations:
- Exercise caution in volatile markets where the RSI may produce false signals.
- Adjust trading parameters based on market conditions and the width of the trading range.
- Use additional confirmation from other indicators or price patterns to validate trading decisions.
Trading with the RSI involves a combination of technical analysis, market observation, and risk management. Traders should choose strategies that align with their trading goals, risk tolerance, and market conditions. Additionally, backtesting, consistent implementation, and adapting to evolving market dynamics are crucial for optimizing the effectiveness of RSI-based trading methods.
Limitations of the RSI Indicator
While the Relative Strength Index is a powerful ally in a Forex trader’s arsenal, its application is tempered by certain inherent limitations:
- False Signals: Like any indicator, the RSI is prone to generating false signals, especially in volatile or range-bound market conditions. Prudent traders exercise caution and complement RSI-based signals with corroborative evidence to mitigate the risk of misinterpretations.
- Lagging Nature: As a lagging indicator based on historical price data, the RSI may sometimes lag behind prevailing market trends, compromising its predictive efficiency. Traders aware of this inherent delay often employ complementary leading indicators to enhance the timeliness and accuracy of their trading decisions.
- Whipsaw Phenomenon: In choppy market environments, the RSI indicator may produce whipsaw signals characterized by sudden reversals shortly after a signal is generated. Traders attuned to market volatility exercise caution and adopt robust risk management protocols to mitigate the adverse impacts of whipsaw-induced losses.
Conclusion
In summary, the Relative Strength Index emerges as an indispensable tool in the repertoire of Forex traders, offering valuable insights into market dynamics and facilitating astute trading decisions. By understanding the nuances of RSI interpretation and skillfully integrating it into their trading strategies, traders can harness its predictive potential to capitalize on profitable opportunities while mitigating inherent risks.
Nonetheless, prudence dictates that traders remain cognizant of the RSI’s limitations and employ judicious caution, complementing RSI-based analyses with supplementary technical indicators and robust risk management protocols. In doing so, traders can confidently navigate the intricate realm of Forex trading, leveraging the RSI as a beacon of insight amid the turbulent seas of market volatility.