What is a Technical Indicator? Types of Indicators in Forex
Forex Trading is a complex and ever-evolving landscape that requires a lot of expertise and knowledge to navigate. One of the key tools used in Forex trading is a indicator. Forex indicators are essentially mathematical calculations used to analyze market trends and help traders make better decisions. In this article from the OmegaFinex broker website, we will fully explain what a Technical indicator is, how they are used in trading, and introduce different types of indicators in Forex.
What is a Forex Indicator?
A Forex indicator is a tool used by traders for technical analysis and identifying trading opportunities. They use mathematical calculations based on past market price and volume data to provide insights into market direction. Different types of indicators in Forex can be used to identify entry and exit points and to help traders manage risk.
Technical indicators are essential tools for traders because they help traders make more informed trading decisions. They can be used along with other technical analysis tools in Forex, such as trend lines, support and resistance levels, and chart patterns like harmonic patterns, to create a more comprehensive trading strategy. For information on how to install indicators in MetaTrader, you can read the tutorial available in the site’s archive.
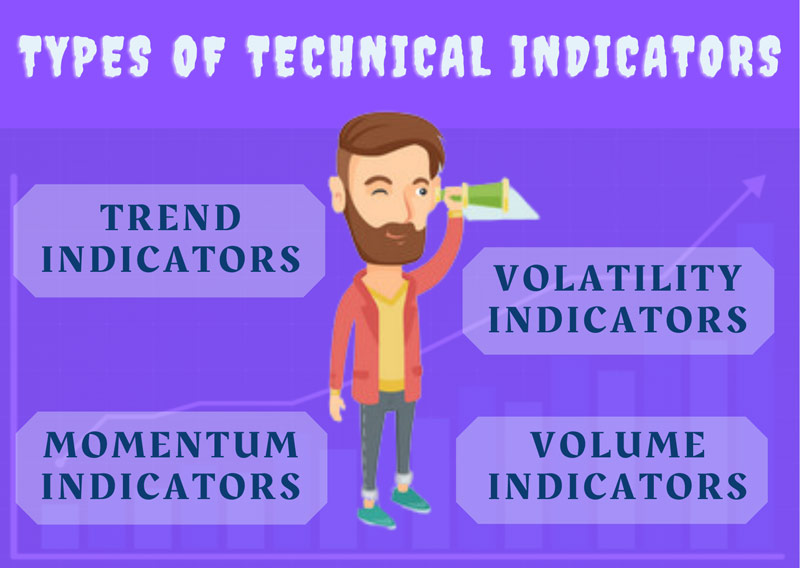
Types of Indicators in Forex
Now that we understand what a technical indicator is, we can start discussing the main topic of introducing them. There are four main types of indicators in Forex:
- Trend Indicators
- Momentum Indicators
- Volatility Indicators
- Volume Indicators
Trend Indicators: The first category of Forex indicators are those that use trends to identify market direction. They are usually plotted on price charts and help traders determine whether the market is trending upwards, downwards, or is range-bound. Some common examples of these indicators include moving averages, the Average Directional Index (ADX), and the Ichimoku indicator. Moving averages are one of the most popular trend indicators as they help reduce price fluctuations and provide traders with a clearer view of the overall trend.
Momentum Indicators: The next category of Technical indicators is momentum indicators, which measure the speed and momentum of price movement in a currency pair. They can help traders identify potential trend reversals and confirm existing trends. Some common examples of momentum Forex indicators are the Relative Strength Index (RSI), Stochastic Oscillator, and the Moving Average Convergence Divergence (MACD). The RSI measures the magnitude of recent price changes to determine whether a currency pair is overbought or oversold, while the Stochastic Oscillator compares the current price to its range over a specific period.
Volatility Indicators: The next type of indicators in Forex measures the degree of price movement in a currency pair. They can help traders identify potential changes in market conditions and adjust their position sizes and risk management strategies accordingly. Some common examples of volatility indicators include the Average True Range (ATR), Bollinger Bands, and the Donchian Channel. ATR measures the average range of price movement in a currency pair over a specific period, while Bollinger Bands use standard deviations to identify support and resistance levels.
Volume Indicators: The last type of indicators in Forex measures the level of trading activity in a currency pair. They can help traders identify changes in market sentiment and confirm existing trends. Some common examples of volume indicators include On-Balance Volume (OBV), the Money Flow Index (MFI), and the Chaikin Indicator. OBV measures the cumulative volume of a currency pair to determine whether buying or selling pressure is dominant, while the Chaikin Indicator combines volume and price data to determine the strength of market momentum.
Overall, it’s important to note that no single indicator is perfect, and traders should use multiple Forex indicators in combination to confirm trends and identify trading opportunities. Additionally, traders should always use technical analysis in conjunction with fundamental analysis and risk management strategies to make informed trading decisions. It’s also important to understand that relying solely on technical analysis and indicators for trading in the Forex market is not enough; fundamental analysis and awareness of the economic calendar and important Forex news are crucial for success and should be used together.
What is the Most Common Technical Indicator?
The next important question is, what is the most commonly used Forex indicator, and among all the different types, which ones do traders use the most? Various indicators are used in trading, each with its own strengths and weaknesses. Some of the most common types of indicators in Forex include:
Moving Averages Forex Indicator
Moving averages are one of the most widely used types of indicators in Forex. They are calculated by taking the average price of a currency pair over a specific period, such as 10 days or 50 days. Moving averages can be used to identify the overall market direction as well as potential support and resistance levels.
There are three main types of moving averages: Simple Moving Average (SMA), Exponential Moving Average (EMA), and Weighted Moving Average (WMA). SMAs are the simplest type of moving average, while EMAs and WMAs give more weight to recent price action.
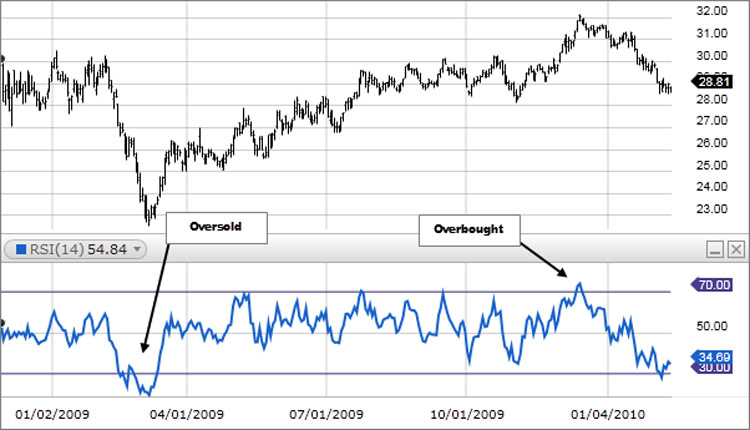
Relative Strength Index (RSI)
The Relative Strength Index (RSI) is a momentum indicator that measures the strength of a currency pair’s price movement. It is calculated by comparing the average gains and losses over a specific period, usually 14 days.
RSI ranges from 0 to 100, with readings above 70 indicating overbought conditions and readings below 30 indicating oversold conditions. Traders can use this Technical indicator to identify potential reversal points as well as to confirm trends.
MACD Technical Indicator
The MACD (Moving Average Convergence Divergence) indicator is a trend-following tool used to identify potential trend reversals. It is calculated by subtracting the 26-day Exponential Moving Average (EMA) from the 12-day EMA.
This Technical indicator also includes a signal line, which is a 9-day EMA of the MACD line. When the MACD line crosses above the signal line, it is a bullish signal, while a cross below the signal line indicates a bearish signal.
Bollinger Bands
Bollinger Bands are a volatility indicator consisting of three lines: a Simple Moving Average (SMA) in the middle and two standard deviation lines above and below the SMA. Bollinger Bands can be used to identify potential breakouts and measure market volatility.
When the market is trending, prices tend to stay within the Bollinger Bands. However, when the market becomes more volatile, prices may break through one of the bands, indicating a potential reversal or breakout.
Fibonacci Retracement Forex Indicator
The Fibonacci retracement indicator is a technical views and tool that uses horizontal lines to indicate areas of support or resistance at key Fibonacci levels before the price continues in its original direction. These levels are calculated using the Fibonacci sequence, a series of numbers where each number is the sum of the two preceding ones.
Traders use these types of indicators in Forex to identify potential support or resistance levels where the price may bounce and continue in the original direction. Key Fibonacci levels are 23.6%, 38.2%, 50%, 61.8%, and 100%. Fibonacci retracements are often used in conjunction with other technical analysis tools, such as trend lines and moving averages, to create a more comprehensive trading strategy.
Stochastic Oscillator
The Stochastic Oscillator is a momentum forex indicator that compares the closing price of a currency pair to its price range over a specific period. The Stochastic Oscillator ranges from 0 to 100, with readings above 80 indicating overbought conditions and readings below 20 indicating oversold conditions.
Traders can use the Stochastic Oscillator to identify potential trend reversals and confirm trends. However, it is important to note that this Forex indicator can produce false signals in ranging markets.
Average True Range (ATR)
The Average True Range (ATR) is a type of volatility indicator that measures the average range of price movement in a currency pair over a specific period. It is calculated by taking the average of the True Range (TR) over a specific time period. The True Range is the greatest of the following three values:
- The difference between the current high and low.
- The difference between the previous close and the current high.
- The difference between the previous close and the current low.
Traders can use ATR to gauge market volatility and adjust position sizes and stop-loss levels accordingly.
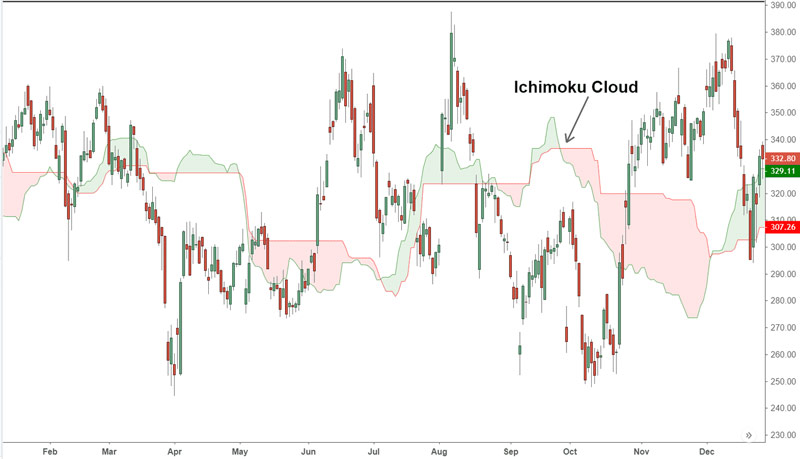
Ichimoku Kinko Hyo Technical Indicator
The Ichimoku Kinko Hyo is a trend-following indicator that uses multiple lines to provide a comprehensive view of market trends. It consists of five lines: Tenkan-sen, Kijun-sen, Senkou Span A, Senkou Span B, and Chikou Span.
- Tenkan-sen and Kijun-sen lines are used to identify short-term and long-term trends, respectively.
- Senkou Span A and Senkou Span B lines form the cloud, which is used to identify potential support and resistance levels.
- Chikou Span is the lagging line used to confirm trends.
The Ichimoku Kinko Hyo is a complex Forex indicator that requires significant expertise and practice to use effectively.
Parabolic SAR Indicator
The Parabolic SAR (Stop and Reverse) indicator is a trend-following tool used to identify potential trend reversals. It consists of points that appear below or above the price, depending on the trend direction.
When the points are below the price, it signals a bullish trend. Conversely, when the points are above the price, it indicates a bearish trend. Traders can use this indicator to identify potential entry and exit points as well as to manage risk.
Must Traders Use Forex Indicators?
No, traders are not required to use all types of indicators in Forex while trading. So why learn and use so many indicators? However, technical indicators can be useful tools for traders looking to make informed trading decisions. Here are some benefits of using them in Forex trading:
- Helps Identify Trends: Forex indicators can help traders identify market trends, which can be useful for making trading decisions. By analyzing price action, traders can determine whether the market is trending upwards, downwards, or sideways. This information can be used to make informed decisions about buying or selling a currency pair.
- Provides Trading Signals: Different types of indicators in Forex can provide trading signals that help traders identify trading opportunities. For example, when a moving average crosses above or below the price chart of a currency pair, it can signal that a trend is changing. Traders can use these signals to enter or exit a trade.
- Confirms Market Conditions: Technical indicators can help confirm market conditions by providing information about market volatility, momentum, and volume. This information can be used to adjust position sizes and risk management strategies accordingly.
- Saves Time: They can save time by automating technical analysis. Instead of manually analyzing price charts, traders can use various Forex indicators to quickly identify trends and potential trading opportunities.
- Customizable: Technical Indicators can be customized to fit a trader’s specific style and preferences. Traders can adjust an indicator’s settings to match their individual needs and trading strategies.
Summary
Forex indicators are essential tools for traders as they can provide insights into market trends and help traders make better trading decisions. There are various types of indicators, each with its unique strengths and weaknesses.
Using different types of indicators in Forex can help traders make more informed trading decisions, save time, and customize their trading strategies. However, it’s important to note that indicators should not be relied upon exclusively and should be used alongside other forms of analysis and risk management strategies.
Traders should use various Technical indicators in conjunction with other technical analysis tools, such as trend lines, support and resistance levels, and chart patterns, to create a more comprehensive trading strategy. It’s crucial to remember that no single indicator is perfect.