What is MACD Indicator? How to Trade MACD in Forex
The MACD indicator (Moving Average Convergence Divergence) is one of the most popular and widely used technical analysis tools in forex trading. Created by Gerald Appel in the late 1970s, MACD helps traders identify potential buy and sell signals based on the momentum and trend-following characteristics of currency pairs. In this forex tutorial from OmegaFinex broker, we will explore how the MACD indicator works, how to interpret it, and how to use it effectively in your forex trading strategy.
What is the MACD Indicator?
The MACD indicator(Moving Average Convergence Divergence), like the RSI indicator, is a popular tool in forex, stock, and indices trading. It helps traders identify changes in momentum, trend direction, and potential buy or sell signals. It consists of three main components:
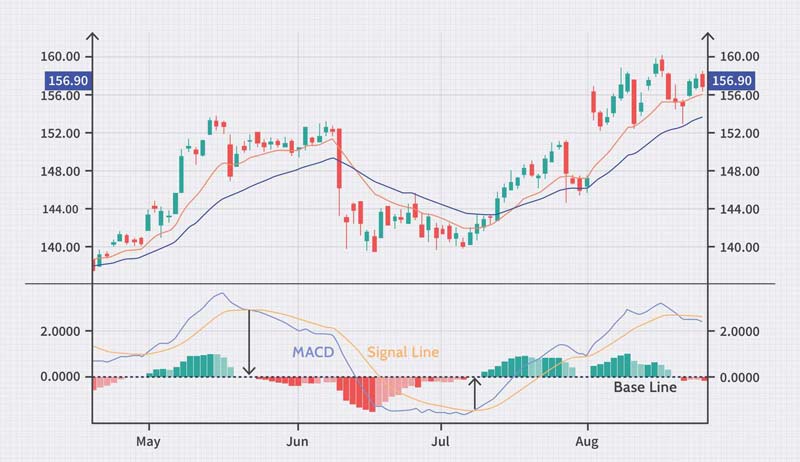
the MACD line, the signal line, and the histogram. The MACD line is calculated by subtracting a long-term exponential moving average (EMA), usually a 26-day EMA, from a short-term EMA, typically a 12-day EMA. The signal line is a 9-day EMA of the MACD line, which acts as a trigger for buy and sell signals.
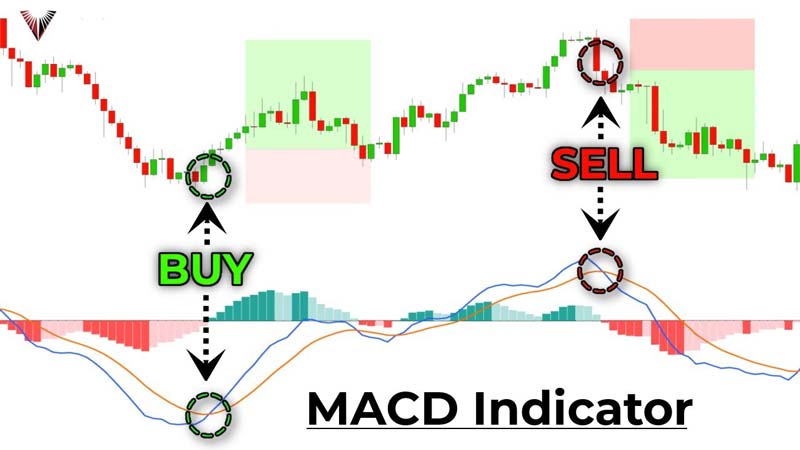
Traders primarily use the MACD indicator to spot crossovers between the MACD line and the signal line. When the MACD line crosses above the signal line, a bullish crossover occurs, indicating potential upward momentum and a possible buying opportunity. Conversely, a bearish crossover happens when the MACD line crosses below the signal line, signaling potential downward momentum and a possible selling opportunity. The histogram, which represents the difference between the MACD line and the signal line, helps visualize the strength of the momentum.
In addition to crossovers, traders also look for the MACD lines crossing above or below the zero line, which can indicate changes in market trends. When the MACD line is above the zero line, it suggests that short-term momentum is stronger than long-term momentum, and the market may be in an uptrend. When the MACD line is below the zero line, it indicates that the market may be in a downtrend.
While the MACD indicator is a versatile and widely used technical indicator in forex trading across various trading platforms like MetaTrader 4 and MetaTrader 5, it’s important to remember that it is a lagging indicator based on historical price data. This means it might not provide timely signals in rapidly moving markets, and there is a risk of false signals, especially in volatile or choppy market conditions. Therefore, many traders combine the MACD with other indicators and fundamental and technical views and analysis techniques to confirm signals and enhance their trading decisions.
Understanding MACD Components
MACD Line: This line in the MACD indicator reflects the difference between the 12-day EMA and the 26-day EMA. When the MACD line crosses above the zero line, it indicates that the short-term EMA is higher than the long-term EMA, signaling upward momentum. Conversely, when the MACD line crosses below the zero line, it indicates downward momentum.
Signal Line: The signal line smooths the MACD line and acts as a trigger for trading signals. When the MACD line crosses above the signal line, a bullish signal is generated, indicating it might be a good time to buy. When the MACD line crosses below the signal line, a bearish signal is generated, indicating it might be a good time to sell.
Histogram: The histogram measures the distance between the MACD line and the signal line. When the histogram in the MACD indicator is positive (above the zero line), it indicates that the MACD line is above the signal line, and the market is bullish. When the histogram is negative (below the zero line), it indicates that the MACD line is below the signal line, and the market is bearish.
How to Interpret the MACD Indicator
The MACD indicator can be interpreted in several ways to generate trading signals:
Crossover Signals
Bullish Crossover: When the MACD line crosses above the signal line, it is a bullish signal from the MACD indicator. This suggests that the market momentum is shifting upwards, and it might be a good time to enter a long (buy) position.
Bearish Crossover: When the MACD line crosses below the signal line, it is a bearish signal in the MACD indicator. This suggests that the market momentum is shifting downwards, and it might be a good time to enter a short (sell) position.
Zero Line Crossovers
MACD Above Zero: When the MACD line is above the zero line, it indicates that the short-term EMA is above the long-term EMA, signaling upward momentum.
MACD Below Zero: When the MACD line is below the zero line, it indicates that the short-term EMA is below the long-term EMA, signaling downward momentum.
Divergence in the MACD Indicator
Bullish Divergence: Occurs when the price of a currency pair makes a new low, but the MACD line makes a higher low. This divergence in the MACD indicator indicates that selling momentum is weakening, and a bullish reversal may be on the horizon.
Bearish Divergence: Occurs when the price of a currency pair makes a new high, but the MACD line makes a lower high. This divergence in the MACD indicator indicates that buying momentum is weakening, and a bearish reversal may be imminent.
 Using MACD in Forex Trading
The MACD indicator can be used in various ways depending on your trading style and goals. Here are some common strategies:
- Basic MACD Strategy: Enter a long position when the MACD line crosses above the signal line (buy signal). Enter a short position when the MACD line crosses below the signal line (sell signal).
- MACD and Support/Resistance Levels: Combine the MACD indicator with support and resistance levels to increase the reliability of your signals. For example, a bullish MACD crossover near a key support level can reinforce a buy signal.
- MACD and Trend Lines: Use trend lines to identify the overall market direction. The MACD indicator can help confirm the strength of the trend. For example, if the MACD is above the zero line and the trend is upward, it may be a good opportunity to buy.
- MACD and Price Patterns: Integrate the MACD indicator with price patterns like head and shoulders, double tops, and double bottoms. MACD can confirm the direction of the breakout, providing more confidence in your trade.
- Divergence Trading: Look for divergences between the MACD indicator and price. This can be a strong signal that the current trend may be losing strength and a reversal may be near.
Benefits of Using MACD indicator
Versatility: The MACD indicator can be used in various market conditions, making it a versatile tool for traders.
Simplicity: Despite its effectiveness, the MACD is relatively simple to understand and use.
Shows Momentum and Trend: The MACD indicator provides insights into momentum and trend, allowing traders to make informed decisions.
Limitations
Lagging Indicator: The MACD is based on moving averages, which are lagging indicators. This means it may not provide timely signals in rapidly moving markets.
False Signals: In choppy or changing markets, the MACD may produce false signals, leading to potential losses.
Need for Confirmation: It is often wise to use the MACD indicator alongside other indicators or analysis techniques to confirm signals and reduce the chances of false trades.
Conclusion on MACD Indicator
The MACD indicator is a powerful and widely used tool in forex trading that can help traders identify trends, momentum shifts, and potential reversals. By understanding how MACD works and incorporating it into your trading strategy, you can enhance your decision-making process and increase your chances of success in the forex market. However, like any other indicator, MACD is not foolproof and should be used in conjunction with other tools and analysis techniques for the best results.